Contents |
Introduction
As with any parameter to be monitored on dairy farms, the analysis of input values must be kept in context with the farm’s management goals and objectives. This is true for reproduction, milk production, and components as well as parlor performance and milking management. When considering milking management, we will first of all assume that the basic principles of sound milking procedures and quality milk production are followed. So, the primary goal for all dairy operations should be to have their milking teams apply the claws to clean, dried teats on well-stimulated cows. Additionally, we will assume that once the claw has been attached, it should be balanced for efficient milk-out and removed at a relatively consistent threshold for low milk flow (whether done manually or through automation). Unfortunately, there will always be some producers for which these assumptions do not hold true. So, for the sake of this discussion, we will disregard this minority.
Please check this link first if you are interested in organic or specialty dairy production
On many large dairies that milk three times per day, parlor size limits the maximum number of cows that can be milked in a 24-hour period. Separate hospital parlors have helped reduce the pressure on the main parlor, but all parlors need to have sufficient downtime for cleaning and disinfection. In these milking systems, monitoring parlor throughput is critical. Stewart et al. (1999) discussed many essential parameters to monitor including milk/cow, milk/hour, cows/hour, milk/stall/hour, average flow rates, and average duration. They discussed ways to improve parlor efficiency by decreasing unit on-time and minimizing unit idle-time. On many smaller dairy operations, parlor size is not the limiting bottleneck. On these farms, the milking parlor may sit idle a significant portion of the day. Parlor throughput, while important for efficient use of labor, is not as critical. On these operations, milking teams facing a 20- to 30-minute delay or interruption can still complete the milking and cleaning process in time for the next milking. Without the pressure of continuous cow flow, milk/hour, cows/hour, and milk/stall/hour are not as useful. Both types of farms can utilize information currently being presented in flow rate reports.
This paper will not provide recommendations for proper milking procedures, ultimate take-off settings, or the ideal flow rates. Additionally, this paper will not evaluate the different types of milk meters and other measurement tools. We will assume that the data obtained from the milking systems outputs are relatively accurate, or at least the information is better than no data at all. This paper will address: 1) how to utilize data from computerized milking management systems, and 2) how statistical process control analysis of the data can help monitor procedural drift in the milking process. While the equipment function and settings can have an impact on overall performance, the human factor can be the most significant. The ultimate goal is improved parlor performance, udder health, and milk quality.
Definitions of Terms
The state-of-the art in milking parlor automation relies on the data collected from automatic detachers that may or may not be equipped with milk meters and individual cow identification. The BouMatic/Valley Ag Software effort initiated in 1998 pushed the envelope of parlor performance monitoring. This effort made use of existing data collection capabilities but provided more detailed analysis and reporting than other companies were doing at the time. Most other companies have incorporated many of these features in their hardware and software. Stewart et al. (2001) proposed standardized definitions for automated collection of parlor performance data. Their definitions provided logical and practical terms for use in parlor performance monitoring. They warned that not all manufacturers provide every measurement described, and that some manufacturers may be reporting the information using different definitions or different precisions than noted in their proposal. Therefore, they caution consultants when comparing across manufacturers or even within a given manufacturer with different software and hardware versions. Below is a summary of their recommendations (for their complete definitions with explanations and caveats, the reader is encouraged to review the entire paper, i.e., Stewart et al., 2001).
General Individual Cow Measurements/Calculations
Total Milk Weight: Total weight of milk produced per cow each time she enters the parlor (0.1 kg or lb). However, the smallest resolution that most meters can measure is the size of one dump chamber (usually between 150 and 300 ml or 0.3 to 0.6 lb), so this apparent precision can be misleading. If re-attachments have occurred, this measure should reflect the total milk from all attachments during the same parlor turn.
Duration: Length of time from claw-vacuum-on to claw-vacuum-off (0.1 minute). The goal is to accurately measure the length of time that the teat ends are exposed to the milking unit. The length of time from claw-vacuum-on to claw-vacuum-off is both acceptable and practical for measuring milking duration.
Parlor Stall: Unique numeric identifier for the parlor stall in which the cow was milked.
Attach Time of Day: Time of day that vacuum was applied to claw before attachment (to the nearest 1 to 3 seconds).
ID Time of Day: Time of day cow was identified (to the nearest 1 to 3 seconds).
Individual Cow Milk Flow Pattern Measurements
Capture of milk weights during certain discrete time intervals can be converted to flow rates when time stamps are applied. The time intervals listed below have served well for on-farm management.
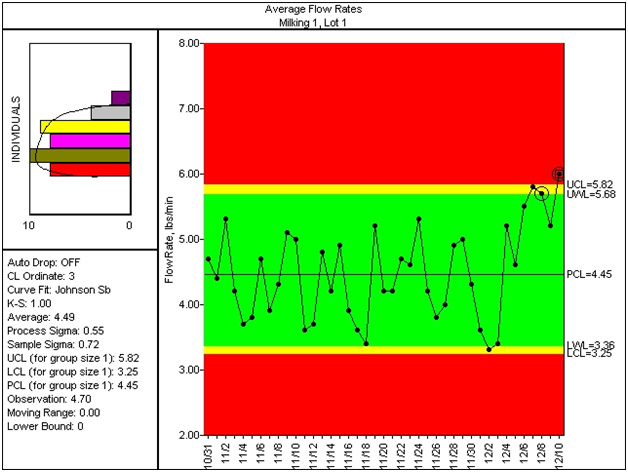
Average Flow Rate: Total milk weight/total duration for individual cow (to the nearest 0.1 kg/min or 0.1 lb/min). The calculation of overall average flow rate is useful in monitoring both udder preparation and machine settings.
Peak Flow Rate: Total milk produced in the second minute post-attachment (60 to 120 seconds). Peak flow rate is useful in monitoring udder preparation and machine settings.
Early Flow Rates: Flow rates in discrete intervals post-attachment (to the nearest 0.1 kg/min or 0.1 lb/min). Flow rates early during milking are potentially useful as monitors of milk letdown and udder preparation. Care must be taken to avoid overinterpretation of individual cow values due to milk meter function. The following intervals have been found to be useful:
Flow in first 15 seconds: Delay from attach to first flow.
Flow 15-30, or flow 30-60 seconds: First flow to peak flow.
Flow 60-120 seconds: Peak flow.
Low Flow Time: Calculated time from a lower flow threshold (e.g., 0.6 kg/min or 1.4 lb/min) to detachment. Reporting time spent in low flow is potentially useful to monitor presence of over-milking (manual settings), poor letdown, overly “dry” take-off settings, or other abnormalities of flow.
Unit Removal and Reattachment Data
For best parlor performance, units should remain on the cows until milk-out is completed, and then units should be promptly removed. The number of cows requiring reattachment should be minimal. Data can be collected to monitor the following: premature unit removal, prolonged over-milking, appropriate reattachment, and inappropriate reattachment. Some manufacturers provide times and production amounts for all attachments and reattachments. Other manufacturers provide more limited data.
Manual Override of Automatic Take-Offs
Most manufacturers allow the user to manually override the automatic take-off settings and remove the unit prior to the level set by the sensor. In certain cases, this can be a source of abuse, while in other cases, it may be an appropriate human intervention. It can arise when workers are rushing the milking, or it can be a sign of over-milking or be a symptom of improperly functioning equipment. Some manufacturers have a flag available to indicate whether the manual override option has been invoked for an individual animal. The required data for examination would include the flag itself, duration, and time of day when the option was used.
Disabling Automatic Take-Offs to Allow Longer Unit On-Times
In many parlors, the most conscientious workers will disable the automatic take-offs (set take-offs to manual), either because of past mechanical malfunctions or the desire to be absolutely certain every cow is completely milked out. To monitor whether this is occurring, a flag can be set to indicate that the automatic take-off was disabled.
Method of Evaluation and Analysis
We need a consistent system to monitor changes in the milking process over time. Most consultants can look at daily milking system values and compare them to “ideal” specifications, but daily variation can have a significant impact on many of these values. How much deviation from the “ideal” specifications can be tolerated? How long can these deviations be tolerated?
Rasmussen (1993) concluded that the milking unit could be detached at a milk flow rate of 400 instead of 200 g/min without having a negative influence on milk yield. Machine-on time was shortened, teat condition improved, and udder health did not seem to be affected. In this study, the human use of the technology was not evaluated. This paper stimulated interest in the manipulation of automatic cluster remover settings. Subsequently, Reid and Stewart (1997) looked at the effects on parlor performance by varying detacher settings. Parlor data were imported into Dairy Comp 305 to evaluate the changes in detacher settings on two case farms. On both farms, flow threshold was significantly increased, and the detach delay was considerably decreased. The results of the manipulations were a reduction in average unit on-time by one minute in both parlors. Additionally, the managers reported less stepping and kicking of cows.
Stewart et al. (1999) showed the effects of gradually increasing take-off settings on a 900-cow dairy milking 3x by monitoring: 1) milk produced per cow per milking, 2) flow rates, and 3) unit on-time. Subsequent weekly values were compared to baseline values from an initial date. Flow rates increased (0.6 lb/min), duration decreased slightly (19.2 sec), and milk production increased (1.6 lb/cow/milking). The additional 20 seconds per cow translated to an additional 20 minutes per milking. and the extra time would be used wisely to improve milk quality. Without additional data and statistical modeling, it is difficult to attribute the increased milk volume to the altered take-off settings. There are too many other variables that can impact milk production.
Stewart and Godden et al. (2002) evaluated the effects of switch point setting changes for automatic cluster remover units on average milking duration, milk flow, and milk yield in a crossover study on five commercial dairy farms. Milk flow was significantly increased at higher switch point settings for all five herds. Higher automatic cluster remover switch point settings did not have a negative effect on milk yield in any of the herds studied and were associated with increased milk yield in two of the five herds. They concluded that decreasing milking duration while either maintaining or increasing the volume of milk harvested should ultimately lead to improved milking efficiency and parlor performance.
Eicker and Stewart (1998) theorized that computerized parlor data could be used to monitor how milkers used the equipment in the parlor. They emphasized the need for viable, efficient evaluation techniques. They indicated that most methods of monitoring parlor efficiency either have been very short term (timing during a portion of a single milking) or very time consuming (viewing videotapes). Using data captured from milk metering devices offer methods of more routine, more rapid monitoring of parlor efficiency.
Statistical process control (SPC) has been promoted as a way to monitor milk quality data from on-farm measurements (Reneau, 2000, Fuhrman, 2002). Data generally suitable for SPC applications are those that are easy and practical to collect, those that are collected on a frequent basis (daily), those that have economic significance, and those that, as directly as is possible, reflect process behavior. The principles of SPC are proven and have been used in manufacturing businesses and the food processing industry for over 70 years. Although the milking process is a unique biological system and has more variability, SPC still can be applied. If SPC is to be useful as a part of a production system, the idea of continuous improvement must be embraced. Experience has shown that application of SPC without commitment to the continuous improvement concept will not be a very productive or satisfying experience. Once data are collected from automated milking systems, SPC is ideally suited to evaluate the performance of the equipment and the milking process.
Statistical Process Control is a set of several analytical tools of which the control charts are integral. Control charts are helpful in signaling that a true change has occurred in a process such as milking parlor performance. The fundamental concept of control charts is to distinguish between inherent random variation and real changes in output, quality, or measured performance. Properly applied control charts can prevent the misinterpretation of inherent random variation due to “common causes” of variation. More importantly, they provide a timely signaling of real change due to “special cause” variation. Common causes affect all data and are chronic, stable, and predictable within limits. Special causes affect some data and are sporadic, unstable, and unpredictable. SPC methods can be used to signal emerging problems and evaluate the positive or negative impact of a change in a management practice or the implementation of a new product.
Accumulating the appropriate data for SPC charting has proven problematic. Most computerized milking systems are very effective at providing “snapshot” data of the most recent milking. Alternatively, some systems will allow the user to scroll back in time and view previous snapshots of milking performance. With quite a bit of computer manipulation of individual reports, some control charts are presented to demonstrate the power and limitations of SPC charting to monitor milking management systems.
Parlor performance data from the Dairy Cattle Research Unit at the University of Illinois were collected for SPC analysis. There were 156 cows milked three times per day in two different lots. Lot 1 held 60 mature Holstein cows, and Lot 2 held 96 cows and was mostly first calf Holstein heifers and Jerseys (10 to 12 of the total 96). The cows were milked in a parallel parlor with Metatron P21 Westfalia Surge equipment and DairyPlan 5.2 software. Data were saved from Oct. 31 through Dec. 10. The cows were fed a TMR at an outdoor feed bunk with headlocks. There was a significant snowstorm on Dec. 1 PM and Dec. 2 AM.
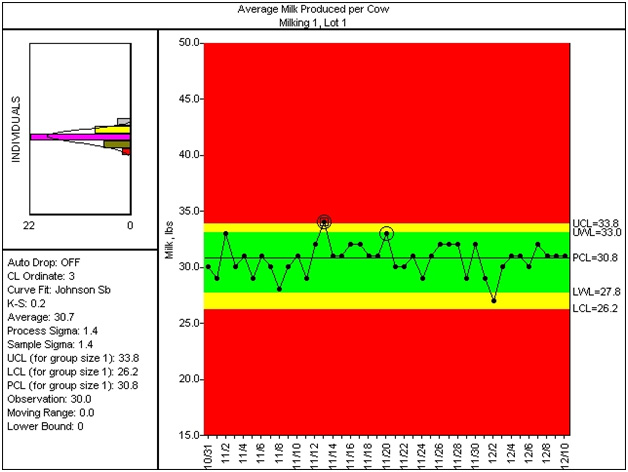
The data were extracted from DairyPlan and pulled into PCDART for reporting. Each day, the PCDART 819 Milking Report – Flow Rate by Group (Figure 1) was saved in a text file, then merged into a spreadsheet to create a time series for SPC analysis. Figures 2 through 5 demonstrate the SPC charts that can help identify procedural drift in the milking process. Just looking at averages can be misleading. Averaging can blunt true changes in the process. For example, one AM milker had decided that nearly all cows in Lot 1 needed to be set to manual take-off to get them completely milked out (Figure 4). This practice was stopped on Dec. 4.


Author Information
Richard L. Wallace
University of Illinois
References
Eicker, S.W. and Stewart, S.C. 1998. Computerized parlor data collection and use: Monitoring the cows, the people, and the parlor. Proceedings of the 39th Annual Meeting of the National Mastitis Council. pp. 98-107.
Fuhrman, T.J. 2002. Quality milk starts with quality management. Proceedings of the 43rd Annual Meeting of the National Mastitis Council. pp 131-139.
Rasmussen, M.D. 1993. Influence of switch level of automatic cluster removers on milking performance and udder health. Journal of Dairy Research 60(3):287-297.
Rasmussen, M.D. 2004. Overmilking and teat condition. Proceedings of the 43rd Annual Meeting of the National Mastitis Council. pp 169-175.
Reid, D.A. and Stewart, S.C. 1997. The effects on parlor performance by variation in detacher settings. Proceedings of the 38th Annual Meeting of the National Mastitis Council. pp 101-104.
Reneau, J.K. 2000. Process control: Timely feedback for quality milk production at the farm. Proceedings of the 41st Annual Meeting of the National Mastitis Council. pp 140-148.
Stewart, S.C., Eicker, S.W., Reid, D.A., and Mein, G. 1999. Using computerized data to find time for milk quality. Proceedings of the 40th Annual Meeting of the National Mastitis Council. pp 116-122.
Stewart, S.C., Eicker, S.W., and Rapnicki, P. 2001. Automated collection of parlor performance data: Information needed and proposed standardized definitions. Proceedings of the 2nd International Symposium on Mastitis and Milk Quality. National Mastitis Council and American Association of Bovine Practitioners. pp 377-381.
Stewart, S.C., Godden, S., Rapnicki, P., Reid, D.A., Johnson, A., and Eicker, S.W. 2002. Effects of automatic cluster remover settings on average milking duration, milk flow, and milk yield. Journal of Dairy Science 85(4):818-823.