Contents |
Abstract
“Sugars,” also known as mono-, di-, and oligosaccharides, are included in the nonfiber carbohydrates. They are rapidly fermented in the rumen, yielding microbial cells, organic acids, gas, and microbial glycogen. Compared to starch, fermentation of sugars appears to yield more butyrate and less microbial protein. Whether sugars yield more or less microbial protein to the animal will likely depend upon the relative rate of microbial protein production versus rate of passage from the rumen and other limiting factors. Feeding studies suggest that sugars can increase the extent of ruminal fermentation of fiber if rumen degradable protein supplementation is adequate, but otherwise they may depress it, even at relatively neutral pH. Lactation studies have suggested that supplementation with sucrose substituted for starch or corn can increase intake, milk yield, and milk fat yield, but the results are mixed. To offer feeding recommendations, further evaluation is needed on impact of the variety of sugars on animal performance as affected by the sugar type and other constituents of the diet.
Please check this link first if you are interested in organic or specialty dairy production.
Introduction
There has been much interest in feeding sugars to dairy cattle in the last few years. One difficulty has been that there is little information on how sugars fit with other ration components (protein fractions, fiber, starch, pectins, etc.), precisely what nutrients they provide to cattle, and what total levels of sugars are in rations. Precise information is not available on sugar feeding levels or how they can be used to enhance production. This paper will provide some background on feeding sugars from purified sources or molasses, but the story is far from complete.
Sugars: Definitions
“Sugars” will be defined for the purposes of this paper as monosaccharides (simple sugars), disaccharides, and oligosaccharides. Analytically, these carbohydrates are separated from polysaccharides (long chains of monosaccharides) by their solubility in 80% ethanol (Asp, 1993). Sugars are nonfiber carbohydrates (NFC), as well as nonstructural carbohydrates (NSC), because they are not included in NDF and are found in the cell contents. Glucose and fructose are the simple sugars most commonly found in plants (Figure 1). The most abundant disaccharide in plants is sucrose, which is a molecule of glucose bonded to fructose. Lactose (glucose + galactose) is found in milk. Maltose is a disaccharide with the same glucose-to-glucose alpha-linkage as starch. Oligosaccharides are chains of monosaccharides that are two to approximately 20 units long. They include stachyose and raffinose found in soybeans (Smith and Circle, 1978), as well as short chain fructans found in cool-season grasses. Except for some of the cool-season grasses, plants do not generally have a large oligosaccharide content.

The sugar content of feedstuffs can vary greatly (Table 1). Mature grains such as corn or oats may contain very little sugar because most of it has been converted to starch. Forages, such as pasture or hay, may have relatively greater amounts of sugars (2 to 12% of dry matter for alfalfa hay; R. Ward, Cumberland Valley Analytical Services, personal communication). The levels in hay are likely to vary with harvest management and how much the plant respires away during the wilting process. By-product feeds, such as molasses, bakery waste, citrus pulp, and almond hulls, tend to have high contents of sugars. However, the variation in processing methods and source material can lead to great variation in sugar content. For example, citrus pulp samples analyzed in our laboratory varied from 12 to 40% sugars on a dry matter (DM) basis. With molasses, the information supplied on the total sugars as invert is a nutritionist’s best guide for the sugar value to place on the feed. Calculation of NFC in molasses (100 – crude protein – NDF – crude fat – ash) as a proxy for sugar content will overestimate both. Molasses may contain 10 to 15% of DM as compounds such as Maillard products and organic acids that are not analyzed for by usual feed analysis methods and so fall by default into NFC (Binkley and Wolfram, 1953). To more accurately describe the carbohydrate content of molasses in feed evaluation programs, add the value of (NFC – total sugars as invert) to the measured ash content of molasses; this will roughly account for the non-carbohydrate materials included in NFC and will prevent overestimation of the available carbohydrate, but it will underestimate the organic acid content.
| Feed | Ash | CP | NDF | NDFCP | Organic Acids | Sugars | Starch | Soluble Fiber |
|---|---|---|---|---|---|---|---|---|
| Alfalfa hay2 | 6.0 | 8.0 | 3.0 | 14.0 | ||||
| Alfalfa hay, CV | 12.1 | 1.7 | ||||||
| Alfalfa hay, CV | 8.2 | 4.5 | ||||||
| Alfalfa hay, FL 4/99 | 9.8 | 21.0 | 37.8 | 4.4 | 5.8 | 16.8 | ||
| Alfalfa hay, 1999 | 10.1 | 20.6 | 37.0 | 3.1 | 5.7 | 1.2 | 17.7 | |
| Alfalfa hay, CA 8/99 | 7.2 | 21.6 | 43.3 | 5.0 | 6.8 | 1.6 | 19.1 | |
| Alfalfa hay, CA 8/99 | 8.7 | 24.8 | 38.7 | 9.1 | 5.7 | 1.8 | 20.8 | |
| Alfalfa hay, CA 8/99 | 12.9 | 25.6 | 32.0 | 7.9 | 5.1 | 3.4 | 19.8 | |
| Alfalfa hay, CA 9/99 | 13.0 | 20.4 | 37.0 | 5.9 | 5.9 | 1.6 | 22.1 | |
| Alfalfa hay, CA 9/99 | 11.9 | 29.4 | 34.2 | 6.0 | 6.0 | 2.0 | 16.0 | |
| Dehy. alfalfa pellets | 4.0 | 17.6 | ||||||
| Alfalfa silage, WH | 9.5 | 19.1 | 45.5 | 2.1 | 10.4 | 1.8 | 0.7 | 12.1 |
| Alfalfa silage, WH | 11.3 | 18.1 | 38.1 | 2.0 | 14.2 | 1.1 | 1.4 | 13.3 |
| Alfalfa silage, CV | 7.7 | 1.1 | ||||||
| Alfalfa silage, CV | 7.3 | 4.9 | ||||||
| Alfalfa silage average | 12.0 | 2.0 | 1.0 | 12.5 | ||||
| Alfalfa stem, mature | 7.8 | 12.4 | 58.0 | 2.3 | 4.6 | 7.2 | 0.3 | 10.8 |
| Alfalfa stem, immature | 14.0 | 18.5 | 32.9 | 1.3 | 0.4 | 16.9 | ||
| Alfalfa leaf mature | 10.5 | 31.5 | 22.2 | 3.1 | 1.0 | 18.4 | ||
| Alfalfa leaf, immature | 9.2 | 29.3 | 18.6 | 1.6 | 9.1 | 10.2 | 3.4 | 19.4 |
| Almond hulls, WH | 5.0 | 7.1 | 26.0 | 1.2 | 8.2 | 32.8 | 1.4 | 16.9 |
| Almond hulls, CA 8/99 | 5.1 | 5.5 | 32.0 | 4.1 | 34.3 | 3.2 | 15.6 | |
| Almond hulls, CA 9/99 | 5.0 | 5.4 | 35.0 | 5.6 | 31.8 | 3.2 | 12.2 | |
| Almond skins, CA 8/01 | 6.0 | 12.2 | 33.0 | 2.4 | 14.3 | 0 | 10.7 | |
| Bakery waste, CA 8/99 | 8.7 | 14.4 | 23.3 | 6.6 | 10.8 | 17.9 | 9.6 | |
| Broccoli | 8.8 | 30.4 | 14.3 | 0.5 | 5.0 | 17.7 | 0.7 | 18.9 |
| Canola meal, CA 8/99 | 8.2 | 40.8 | 27.2 | 9.8 | 9.9 | 2.1 | 13.2 | |
| Canola meal, CA 8/99 | 8.4 | 41.9 | 28.7 | 7.1 | 10.2 | 2.0 | 9.7 | |
| Canola meal, NM 4/01 | 4.4 | 24.0 | 5.6 | 2.8 | 1.3 | 10.6 | ||
| Citrus pulp, FL 4/99 | 8.5 | 8.7 | 24.1 | 4.2 | 13.4 | 1.4 | 37.5 | |
| Citrus pulp, FL 4/99 | 8.5 | 8.2 | 24.4 | 4.2 | 18.4 | 1.6 | 34.5 | |
| Citrus pulp, average3 | 6.7 | 7.2 | 22.1 | 2.9 | 9.0 | 26.5 | 1.0 | 32.9 |
| Citrus pulp, ranges | 4.4-8.7 | 4.1-9.4 | 17.8-29.4 | 1.6 – 4.5 | 12.5-40.2 | 25.2-43.7 | ||
| Corn distillers, ethanol | 14.5 | 6.6 | ||||||
| Corn distillers, whiskey | 6.2 | 4.2 | ||||||
| Corn distillers, FL 4/99 | 4.3 | 31.3 | 58.2 | 15.2 | 11.0 | 2.0 | 8.9 | |
| Corn distillers, FL 5/99 | 4.8 | 28.3 | 54.4 | 14.8 | 5.4 | 3.1 | 7.8 | |
| Corn distillers, 1999 | 4.3 | 30.3 | 46.3 | 12.7 | 3.2 | 0.5 | 11.6 | |
| Corn distillers, CA 8/99 | 6.43 | 31.6 | 50.9 | 15.7 | 7.5 | 1.1 | 9.9 | |
| Corn gluten feed | 5.9 | 16.4 | ||||||
| Corn grain, WH | 1.5 | 9.0 | 12.6 | 0.7 | 0.7 | 0 | 64.0 | 8.1 |
| Corn grain, CV | 5.2 | 60.8 | ||||||
| Corn meal, FL 4/99 | 1.6 | 8.9 | 20.5 | 3.6 | 0 | 66.2 | 6.4 | |
| Corn meal, FL 5/99 | 3.3 | 9.0 | 15.7 | 3.8 | 4.5 | 55.9 | 10.6 | |
| Corn meal, 1999 | 1.1 | 9.5 | 11.8 | 2.9 | 2.3 | 65.8 | 8.6 | |
| Corn, rolled, CA 8/99 | 1.5 | 9.7 | 15.2 | 6.9 | 2.2 | 60.1 | 12.1 | |
| Corn, rolled, CA 8/99 | 1.5 | 9.1 | 16.1 | 5.3 | 0.9 | 62.6 | 8.6 | |
| Corn silage, WH | 4.9 | 7.5 | 50.9 | 0.9 | 10.6 | 0.9 | 18.9 | 4.3 |
| Corn silage, WH | 3.8 | 7.0 | 41.8 | 0.6 | 7.9 | 0.3 | 30.4 | 5.8 |
| Corn silage, CV | 3.4 | 14.4 | ||||||
| Corn silage, CV | 4.7 | 29.9 | ||||||
| Corn silage, FL 4/99 | 4.8 | 10.2 | 51.1 | 4.4 | 0.5 | 19.4 | 7.0 | |
| Corn silage, FL 5/99 | 3.8 | 10.4 | 51.1 | 3.4 | 4.6 | 23.6 | 3.2 | |
| Corn silage, CA, 8/99 | 12.8 | 11.4 | 55.2 | 4.3 | 0.8 | 7.2 | 10.8 | |
| Corn silage, CA 8/99 | 6.3 | 7.5 | 47.7 | 6.5 | 1.3 | 21.2 | 15.7 | |
| Corn silage, OH | 12.1 | 47.1 | 1.6 | 3.3 | 18.1 | 11.1 | ||
| Corn silage, OH | 4.0 | 48.8 | 1.3 | 0.9 | 19.5 | 7.7 | ||
| Cottonseed, whole | 1.0 | 8.5 | ||||||
| Ctsd whole, FL 4/99 | 4.2 | 24.2 | 48.3 | 6.2 | 1.6 | 6.8 | ||
| Ctsd whole, FL 5/99 | 4.1 | 23.3 | 47.6 | 5.6 | 5.9 | 0.8 | 10.8 | |
| Cottonseed hulls | < 1.0 | 4.0 | ||||||
| Green peas (frozen) | 3.2 | 25.9 | 18.2 | 0.4 | 1.7 | 25.0 | 20.6 | 2.4 |
| Molasses, cane | 55+ | |||||||
| Oat hay, CA 8/99 | 10.6 | 8.7 | 68.0 | 3.8 | 3.2 | 2.8 | 9.4 | |
| Potatoes | 4.8 | 57.5 | ||||||
| Soybean meal (48%) | 6.5 | 52.7 | 10.9 | 1.4 | 4.2 | 10.9 | 1.0 | 14.0 |
| SBM (48%) FL 4/99 | 7.3 | 56.9 | 14.4 | 8.6 | 11.9 | 2.4 | 18.8 | |
| SBM (48%) FL 5/99 | 7.0 | 56.3 | 16.0 | 8.5 | 11.6 | 2.1 | 14.0 | |
| SBM (48%) 1999 | 56.7 | 9.7 | 3.2 | 10.2 | 0.5 | 16.9 | ||
| Wet soy product, CA, 99 | 4.1 | 32.0 | 25.6 | 1.6 | 0.8 | 0.6 | 31.4 | |
| Soybean hulls | 4.2 | 9.8 | 69.0 | 4.0 | < 1 | < 1 | 1 | 17.4 |
| Sugar beet pulp, ID 3/94 | 8.9 | 8.0 | 44.6 | 5.1 | 0.4 | 12.8 | 0 | 30.0 |
| Sugar beet pulp,CA 8/99 | 9.1 | 9.6 | 51.1 | 7.3 | 14.2 | 1.7 | 17.4 | |
| Sugar beet pulp,CA 8/99 | 7.4 | 9.8 | 39.8 | 5.7 | 24.7 | 2.3 | 20.1 | |
| Timothy hay | 5.0 | 8.2 | 67.3 | 1.8 | 4.4 | 9.1 | 0.4 | 6.4 |
| Ground wheat | 1.7 | 10.9 | 12.1 | 1.1 | 0 | 1.8 | 64.6 | 8.8 |
| Wheat middlings | 5.5 | 19.0 | 42.3 | 3.4 | 4.6 | 5.4 | 21.0 | 3.4 |
| Wheat silage, CA 9/99 | 12.4 | 12.8 | 50.8 | 6.1 | 2.5 | 2.7 | 16.8 | |
|
1Capitalized abbreviations denote lab source, bold font capitalized abbreviations indicate state and date of origin. CP = crude protein, NDF = neutral detergent fiber, NDFCP = neutral detergent fiber crude protein, and SBM = soybean meal. 2Alfalfa hay: soluble fiber content decreases with increasing maturity and with leaf loss. 3Results from analyses of 79 dried citrus pulp samples. |
||||||||
Fermented feeds, including silages, distillers grains, or brewers grains, should have little remaining glucose, fructose, or sucrose, as they should have been largely consumed in the fermentation. A possible exception might be immature corn silage where available sugars exceed the amount needed to decrease pH for preservation. The surprisingly high sugar content (5 to 11% of DM) noted for some distillers grains and alfalfa haylage samples may reflect fragments of other carbohydrates that were hydrolyzed during the fermentation or with the acidic conditions of ensiling (Jones et al., 1992). It has been suggested that these sugars do not support the same microbial performance as glucose, fructose, and sucrose (W. Hoover, West Virginia University, personal communication).
Digestion/Fermentation
The products of digestion will determine the nutrients available to the animal for production, so we begin here. Except for the monosaccharides and maltose, sugars may not be well digested in the small intestine of cows, but it is likely that little escapes fermentation in the rumen. Without linkages to other carbohydrates, and with high solubilities (glucose: 90.9 g/100 ml; sucrose: 200 g/100 ml; fructose: “freely soluble”; Merck Index, 1996), there is little except for physical access to impede microbial fermentation. However, rates of more than 100% h-1 may more closely reflect disappearance than usage. Rates of microbial fermentation of 30 to 40% h-1 for sugars may be more realistic (W.W. Hoover, West Virginia University, personal communication: M.B. Hall, unpublished). Microbes fermenting glucose, fructose, or sucrose produce organic acids, gas (CO2 and CH4), microbial mass, and glycogen. Thomas (1960) demonstrated that both bacteria and protozoa convert some portion of sugar and fructan substrates to stored microbial glycogen. In that study, glycogen accumulation peaked at 2 to 4 hours of fermentation and then declined.
If some portion of the sugar is stored as glycogen, then they did not ferment per se, despite the disappearance of substrate. Additionally, because of the conversion of sugars to glycogen, there can be a significant flow of alpha-linked glucan (likely will digest like starch) to the small intestine, even on all-forage rations (e.g., hay) (Branco et al., 1999). The maximal microbial protein yield of sucrose was approximately 86% of that achieved by starch when both were fermented in vitro with isolated neutral detergent fiber (Hall and Herejk, 2001). This lesser protein yield may be related to conversion of a portion of the sucrose to glycogen rather than its direct fermentation and difference in mass of monosaccharide in the substrates (see last section).
Relative to starch, fermentation of sugars tends to yield relatively more butyrate and similar to slightly lesser amounts of propionate (Strobel and Russell, 1986; Heldt et al., 1999); there is greater potential for lactate production with sugars (Cullen et al., 1986; Strobel and Russell, 1986; Heldt, et al., 1999). The tendency to produce more lactic acid was greater at lower pH (Strobel and Russell, 1986). Fermentation of sugars plus malate with monensin increased the yield of propionate but not at all of the sugar concentrations evaluated (Martin et al., 2000).
There may also be differences among sugar sources in their yields of organic acids, as affected by protein supplementation. Ruminal fluid concentrations of organic acids was highest for steers supplemented [0.30% of body weight (BW)] with sucrose (83.4 mM), as compared to those supplemented with glucose (74.9 mM) or fructose (76.1 mM) (P = 0.05), when supplemented with 0.031% of BW as rumen degradable protein (RDP). The monosaccharides yielded a greater molar proportion of acetate than did sucrose (P = 0.05), but the sugars did not differ in propionate (P = 0.49), butyrate (P = 0.12), or lactate (P = 0.26). The differences between sucrose versus glucose and fructose were not significant when RDP supplementation was increased to 0.122% of BW (Heldt et al., 1999).
The type and amount of organic acid production from sugars may have implications for their ability to elicit specific responses as compared to other carbohydrates. Butyrate is metabolized by the gut epithelium and is preferentially utilized as an energy source for colonic epithelial cells (Bergman, 1990). Butyrate is also more effective than propionate or acetate in eliciting development of rumen papillae (Van Soest, 1994). Accordingly, sugar feeding has the possibility of enhancing rumen papillae development as compared to other carbohydrate sources. Differences in yields of propionate would alter the supply of gluconeogenic precursors to the animal.
Despite the potential for lactate production, ruminal degradation of lactate, the conversion of sugars to glycogen, and changes in rate of passage may lessen the impact of sugar fermentation on ruminal pH. Among the ways that carbohydrates can avoid contributing to lower ruminal pH are: 1) to enhance flow of fermentable materials from the rumen so they do not yield acids in the rumen, or 2) yield products other than organic acids. Increased intake noted with sugar feeding (Broderick et al., 2000) may be related to increased rates of solid or liquid passage from the rumen. The results have been few and mixed regarding effects of sugar on rate of passage. When glucose syrup equivalent to 16.8% of dietary organic matter (OM) was infused into the rumen, OM passage to the small intestine increased (Jersey cows; Rooke et al., 1987). However, the glucose treatment did not differ from the control for the passage of OM per gram of OM intake. In a study with heifers, dextrose (5.6% of dietary DM; 74.5% forage) did not affect the fluid dilution rate but increased the rate of solid passage from the rumen. This rate was similar to that of a ration containing more concentrate (48.34% forage) (Piwonka et al., 1994). Sucrose fed at 14.2% of ration DM increased ruminal fluid dilution rate as it decreased rumen fluid volume (sheep; Sutoh et al., 1996).
Sugars can differ from starch in their effect on the temporal pattern of ruminal pH. In diets ranging from 0 to 30% molasses fed with concentrate and wheat straw, ruminal pH decreased to its lowest level (6.42 for 0% to 6.33 for 30% molasses) by 1 hour post-feeding. Not surprisingly, ruminal pH and volatile fatty acid concentration of rumen contents showed an inverse relationship (Sahoo et al., 1999). In another study in which beef steers were fed low-quality tallgrass-prairie hay supplemented with 0.122% of BW as supplemental RDP and 0.30% of BW as glucose, fructose, or sucrose, ruminal pH reached its nadir at 3 hours post-feeding (earliest sampling point) for the sugars, whereas ruminal pH of cattle receiving starch reached the lowest pH at 9 hours post-feeding (Heldt et al., 1999). In this study, the average ruminal pH of the starch-fed animals was lower than those receiving one of the sugar treatments (P = 0.04), and pH did not differ among sugar supplements.
Sucrose and molasses fed at high levels have been shown to decrease ruminal fiber digestion. On grass silage/barley/rapeseed meal diets (11.7lb/DM intake per day) fed to cattle, supplementation of 2.2 lb/day of sucrose (~15.9% of dietary DM) decreased ruminal NDF digestion, but inclusion of sodium bicarbonate reversed that depression (Khalili and Huhtanen, 1991), suggesting a pH-related effect. In that study, lag time for NDF digestion increased on sucrose treatments. A companion study showed that the sucrose supplementation also decreased the rate of ruminal NDF digestion (Huhtanen and Khalili, 1991). In feeding trials with ammoniated tropical grasses supplemented with urea or cottonseed meal and molasses at 25% of ration DM (Brown 1990) or offered free choice and consumed at 35 (with cottonseed meal) to 37% of intake DM (Brown 1993), NDF digestibility was decreased by 5 percentage units and 3.5 to 5.2 percentage units, respectively.
The effect of sugars on fiber digestibility appears to be at least partly dependent upon dietary protein supplementation. Increasing supplementation of RDP from 0.031% to 0.122% of BW to steers consuming low-quality tallgrass-prairie hay changed the impacts of starch, glucose, fructose, or sucrose (0.30% of BW) on fiber digestion. At the lower protein inclusion, all supplements depressed ruminal NDF digestion as compared to the control. At the higher protein inclusion, extent of NDF fermentation increased with sugar supplementation (Heldt et al., 1999). In an in vitro fermentation with mixed ruminal microbes where available nitrogen should not have been limiting, supplementation with sucrose increased the rate of NDF digestion in a 24-hour period as compared to NDF fermented alone (Holsthausen and Hall, 2002).
The depression in NDF digestibility with sugar feeding may be a function of changing ruminal pH and/or a competition between fiber and NFC fermenting bacteria for nitrogen and other nutrients (Jones et al., 1998). Adequate nitrogen must be supplemented to the rumen to avoid starving fiber digesters, especially if rapidly growing NFC bacteria are scavenging available nitrogen.
Animal Studies
There have been relatively few animal performance studies using purified sugars. Two studies in which sucrose was substituted for starch in lactating dairy cow rations suggest that sucrose increases milk fat yield, but other results are mixed. When sucrose was substituted for corn meal at 1.5% of ration DM, intake, milk yield, and fat-corrected milk yield did not change, but milk fat yield increased from 2.12 to 2.14 lb per day, and milk protein decreased from 3.51 to 3.28% (Nombekela and Murphy, 1995). In alfalfa silage + corn silage + high-moisture shell corn diets where sucrose was substituted for corn starch (0 to 7.5% of dietary DM, diet NFC ~ 43% of DM; Broderick et al., 2000), there were linear increases in DM intake, milk fat yield (P < 0.05), and a tendency for an increase in 3.5% fat-corrected milk yield (P = 0.11) (Table 2). Milk protein yield was unaffected. In terms of feed efficiency, milk yield / DM intake decreased linearly from 1.60 to 1.52 (P < 0.02), and the conversion of ration nitrogen to milk protein N declined linearly with increasing substitution of sucrose for starch (from ~0.312 to ~0.285; P = 0.01). However, the efficiency of producing 3.5% fat- and protein-corrected milk did not appear to change with diet (no statistics applied). Reports of inefficiency of CP utilization in diets containing sugars as a supplement or in molasses compared to those containing starch or corn (Bell et al., 1953) may be related to sucrose-utilizing microbes storing glycogen rather than fermenting it directly or competing with other microbial populations for nitrogen and other nutrients (Jones et al., 1998).
In a study where fresh annual ryegrass was fed to lactating cows, partial replacement of ground corn with 5% sucrose supplement (brown sugar product, 83.4% sugar) had no impact on total DM intake or on milk and component yields (P > 0.15) (McCormick et al., 2001). Milk yield did decline (P = 0.15) when sucrose-supplemented diets were supplemented with expeller soybean meal, as compared to solvent soybean meal, suggesting different effects with more or less rumen undegradable protein. The difference in the results of this study as compared to that of Broderick et al. (2000) raises the question: Does the base composition of the diet affect the impact of supplemental sugars? The diets in the Broderick et al. (2000) study contained a basal level of 2.7% sugars, whereas the fresh ryegrass in the McCormick et al. (2001) study contained 3.9 to 27.7% of DM as NFC and comprised 51 to 53% of dietary DM. The NFC in ryegrass is likely to be largely comprised of organic acids, sugars, and fructans.
| Sucrose, % of DM | Starch, % of DM | DM Intakea, lb/day | Milk, lb/day | Milk Fata, lb/day | Milk Protein, lb/day | FCMb, lb/day |
|---|---|---|---|---|---|---|
| 0 | 7.5 | 54.0 | 85.8 | 3.24 | 2.73 | 89.3 |
| 2.5 | 5.0 | 56.4 | 89.1 | 3.37 | 2.82 | 93.0 |
| 5.0 | 2.5 | 57.3 | 88.2 | 3.64 | 2.84 | 96.8 |
| 7.5 | 0 | 57.3 | 86.9 | 3.57 | 2.82 | 95.2 |
|
1Data taken from Broderick et al. (2000). FCM = fat-corrected milk. aLinear response (P < 0.05). bTrend for linear response (P = 0.11). |
||||||
The in vivo study of Sannes et al. (2002) reflects the decreased microbial protein yield noted in vitro and changes in organic acid complements. When 3% sucrose plus 13.5% ground corn was substituted for 20% ground corn in low (17%) or high (18.5%) CP diets fed to mid-lactation Holstein cows, ruminal concentrations of ammonia (P = 0.08) and branched chain volatile fatty acids (P = 0.02) were reduced. There was a tendency for reduction in acetate (P = 0.15) on the diets containing sucrose, though there was no dietary effect on ruminal pH (means = 6.02; P = 0.48) (Sannes et al., 2002). Although DM intakes were similar, yields of milk (P = 0.02), milk fat (P = 0.04), milk protein (P = 0.05), and lactose (P = 0.03) decreased with sucrose supplementation. Total urinary N excretion (P = 0.11), milk urea nitrogen (P = 0.06), and predicted microbial CP yield were decreased (P = 0.03) with sucrose supplementation. The decrease in ruminal ammonia and branch chain volatile fatty acids with decreased microbial yield suggests: 1) there was less protein breakdown in the rumen on the sugar diet, or 2) the method of using purine excretion to measure microbial protein yield as it is currently practiced does not accurately predict yield from sugar-utilizing microorganisms. The animal response may suggest a lower protein yield.
Addition of sucrose to pre-fresh diets did not appear to influence lactation performance. Inclusion of 2.7% of dietary DM as sucrose substituted for ground corn in dry cow diets did not change lactation performance but increased blood glucose concentration of the animals supplemented with sucrose (Ordway et al., 2002).
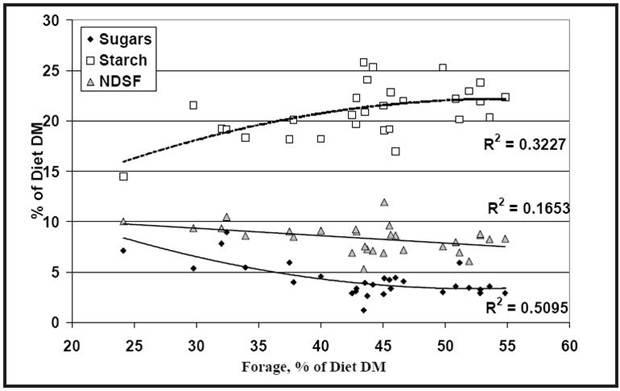
There has been much testimonial in the field about the benefits or lack thereof of sugars added to dairy cattle rations. The greatest difficulty has been that nutritionists have not known what levels of sugars they are starting with, so they would be hard pressed to develop recommendations. Several commercial laboratories are now offering sugar analyses for feedstuffs, which will help to resolve this situation. Anecdotally, it appears that added sugars may have some benefit when the base ration has a low sugar content. Recommendations to provide approximately 5% of the ration as sugars have been suggested. It seems a fairly reasonable value when compared to the levels of sugars estimated to be in rations reported to support good production and health (Figure 2). Our difficulty is that we still do not know how sugars will interact as other carbohydrate and protein components of the ration are altered.
Summary
Sugars differ from other carbohydrates in their effects on animal performance. Based upon in vitro data and upon animal studies, I would suggest considering the following when evaluating the inclusion of sugars in dairy cattle rations:
- Make sure fiber form and amounts are adequate to maintain good rumen function.
- Make sure that enough RDP is available to meet microbial needs. This perhaps can be monitored using milk or plasma urea nitrogen.
- Be able to evaluate animal performance resulting from the ration changes. Feed efficiency may be useful to assess these changes if accurate DM intakes are available.
Food for Thought
For equivalent comparisons of sugars and other carbohydrates, it might be most appropriate to put them on a monosaccharide basis. Why? For one thing, in digestion or fermentation, it is likely that the amount of carbohydrate available on a monosaccharide basis determines the product yield. Secondly, the amount of monosaccharide is greater than the dry weight of di-, oligo-, or polysaccharides because each time two monosaccharides bond, one molecule of water is lost. For example, 1 lb of glucose, a monosaccharide, contains 1 lb of monosaccharides; 1 lb of sucrose, a disaccharide, contains 1.05 lb of monosaccharides, and 1 lb of starch, a polysaccharide, contains 1.11 lb of monosaccharides. The percentage of monosaccharides in a feed from a particular carbohydrate fraction can be calculated as: (% of fraction) / (molecular weight of compound / weight of monosaccharides in compound). For disaccharides containing only hexoses (sucrose, maltose, lactose) the divisor is (342 / 360). For starch, because it is a molecule that varies in molecular weight, the divisor is (162 / 180).
Author Information
Mary Beth Hall
Department of Animal Sciences
University of Florida
References
Asp, N-G. 1993. Nutritional importance and classification of food carbohydrates. In: Plant Polymeric Carbohydrates. F.D. Meuser, J. Manners, and W. Seibel, eds. Royal Society of Chemistry, Cambridge, United Kingdom.
Bell, M.C., W.D. Gallup, and C.K. Whitehair. 1953. Value of urea nitrogen in rations containing different carbohydrate feeds. J. Anim. Sci. 12:787-797.
Bergman, E.N. 1990. Energy contributions of volatile fatty acids from the gastrointestinal tract in various species. Physiological Reviews 70:567-590.
Binkley, W.W., and M.L. Wolfram. 1953. Composition of cane juice and cane final molasses. Scientific Report Series No. 15. Sugar Research Foundation, Inc. New York. Originally published in Advances in Carbohydrate Chemistry, Vol. III, Academic Press, Inc.
Branco, A.F., D.L. Harmon, D.W. Bohnert, B.T. Larson, and M.L. Bauer. 1999. Estimating true digestibility of nonstructural carbohydrates in the small intestine of steers. J. Anim. Sci. 77:1889-1895.
Broderick, G.A., N.D. Luchini, W.J. Radloff, G.A. Varga, and V.A. Ishler. 2000. Effect of replacing dietary starch with sucrose on milk production in lactating dairy cows. U.S. Dairy Forage Research Center, 2000-2001 Research Report, USDA Agricultural Research Service, Madison, Wis. pp. 116-118.
Brown, W.F. 1990. Ammoniation or cane molasses supplementation of tropical grass hay. J. Prod. Agric. 3:377-381.
Brown, W.F. 1993. Cane molasses and cottonseed meal supplementation of ammoniated tropical grass hay for yearling cattle. J. Anim. Sci. 71:3451-3457.
Cullen, A.J., D.L. Harmon, and T.G. Nagaraja. 1986. In vitro fermentation of sugars, grains, and by-product feeds in relation to initiation of ruminal lactate production. J. Dairy Sci. 69:2616-2621.
Hall, M.B., and C. Herejk. 2001. Differences in yields of microbial crude protein from in vitro fermentation of carbohydrates. J. Dairy Sci. 84:2486-2493.
Hall, M.B., and H.H. Van Horn. 2001. How should we formulate for non-NDF carbohydrates? Proc. 12th Annual Florida Ruminant Nutrition Symposium, Gainesville, Fla. pp. 44-50.
Heldt, J.S., R.C. Cochran, G.L. Stokka, C.G. Farmer, C.P. Mathis, E.C. Titgemeyer, and T.G. Nagaraja. 1999. Effects of different supplemental sugars and starch fed in combination with degradable intake protein on low-quality forage use by beef steers. J. Anim. Sci. 77:2793-2802.
Holtshausen, L., and M.B. Hall. 2002. Effect of medium pH on microbial crude protein yield, pH, and neutral detergent fiber digestion from fermentation of neutral detergent fiber and sucrose in vitro. J. Dairy Sci. 85(Suppl. 1):182 (Abstr.).
Huhtanen, P., and H. Khalili. 1991. Sucrose supplements in cattle given grass silage-based diet. 3. Rumen pool size and digestion kinetics. Anim. Feed Sci. Technol. 33:275-287.
Jones, B.A., R.D. Hatfield, and R.E. Muck. 1992. Effect of fermentation and bacterial inoculation on lucerne cell walls. J. Sci. Food Agric. 60:147-153.
Jones, D.F., W.H. Hoover, and T.K. Miller Webster. 1998. Effects of concentrations of peptides on microbial metabolism in continuous culture. J. Anim. Sci. 76:611-616.
Khalili, H., and P. Huhtanen. 1991. Sucrose supplements in cattle given grass silage-based diet. 2. Digestion of cell wall carbohydrates. Anim. Feed Sci. Technol. 33:263-273.
Martin, S.A., H.M. Sullivan, and J.D. Evans. 2000. Effect of sugars and malate on ruminal microorganisms. J. Dairy Sci. 83:2574-2579.
McCormick, M.E., D.D. Redfearn, J.D. Ward, and D.C. Blouin. 2001. Effect of protein source and soluble carbohydrate addition on rumen fermentation and lactation performance of Holstein cows. J. Dairy Sci. 84:1686-1697.
Merck Index, An Encyclopedia of Chemicals, Drugs, and Biologicals. 1996. 12th ed. S. Budavari, ed. Merck & Co., Inc. Whitehouse Station, N.J.
Nombekela, S.W., and M.R. Murphy. 1995. Sucrose supplementation and feed intake of dairy cows in early lactation. J. Dairy Sci. 78:880-885.
Ordway, R.S., V.A. Ishler, and G.A. Varga. 2002. Effects of sucrose supplementation on dry matter intake, milk yield, and blood metabolites of periparturient Holstein dairy cows. J. Dairy Sci. 85:879-888.
Piwonka, E.J., J.L. Firkins, and B.L. Hull. 1994. Digestion in the rumen and total tract of forage-based diets with starch or dextrose supplements fed to Holstein heifers. J. Dairy Sci. 77:1570-1579.
Rooke, J.A., N.H. Lee, and D.G. Armstrong. 1987. The effects of intraruminal infusions of urea, casein, glucose syrup, and a mixture of casein and glucose syrup on nitrogen digestion in the rumen of cattle receiving grass-silage diets. Brit. J. Nutr. 57:89-98.
Sahoo, A., N. Agarwal, D.N. Kamra, L.C. Chaudhary, and N.N. Pathak. 1999. Influence of the level of molasses in de-oiled rice bran-based concentrate mixture on rumen fermentation pattern in crossbred cattle calves. Anim. Feed Sci. Technol. 80:83-90.
Sannes, R.A., M.A. Messman, and D.B. Vagnoni. 2002. Form of rumen-degradable carbohydrate and nitrogen on microbial protein synthesis and protein efficiency of dairy cows. J. Dairy Sci. 85:900-908.
Smith, A.K., and S.J. Circle. 1978. Chemical composition of the seed. In Soybeans: Chemistry and Technology, A.K. Smith and S.J Circle, eds. AVI Publishing, Westport, Conn.
Strobel, H.J., and J.B. Russell. 1986. Effect of pH and energy spilling on bacterial protein synthesis by carbohydrate-limited cultures of mixed rumen bacteria. J. Dairy Sci. 69:2941-2947.
Sutoh, M., Y. Obara, and S. Miyamoto. 1996. The effect of sucrose supplementation on kinetics of nitrogen, ruminal propionate, and plasma glucose in sheep. J. Agric. Sci. (Camb.) 126:99-105.
Thomas, G.J. 1960. Metabolism of the soluble carbohydrates of grasses in the rumen of the sheep. J. Agric. Sci. 54:360-372.
Van Soest, P.J. 1994. Nutritional Ecology of the Ruminant, 2nd ed. Cornell University Press, Ithaca, N.Y.