Introduction
Feed is a significant cost in milk production. Generally over 50% of the production cost may be associated with meeting the nutritional requirements of the lactating cow. Dairies monitor feed cost through feed ingredient purchases, feed delivery records, and weigh backs of refused feed. However, actual costs associated with shrinkage are often ignored. Shrinkage is the loss of feed ingredients that never have a potential for economic return. Generally, shrinkage includes not only storage losses but also excessive inclusion rates in rations that are unnecessary to meet the nutritional needs of the animal. Dutton (1998) defined shrinkage as “the percentage of feed on a farm that is not accounted for by the rations by the animals for which it is intended.” Causes may include wind, wildlife (birds and rodents), moisture, or spoilage. Brouk (2009) also included as other contributors to shrinkage delivery weight errors, discarded feed, feed dispersed by tires and tracking, and mixing errors.
Please check this link first if you are interested in organic or specialty dairy production.
Brouk (2009) indicated shrinkage may represent 15% to 20% of the total feed cost with wet and expensive ingredients representing the greatest concern. Dutton (1998) reported 6% to 8% shrinkage on one dairy but believed most of the shrinkage was due to overfeeding ingredients. He questioned the value of feeding cows more accurately in the northeast United States because many of the overfed ingredients were lower cost per ton. There are limited research reports on the actual shrinkage occurring on dairies. On-site dairy discussions tend toward considering shrinkage a non-issue or part of normal feed cost, and opportunities for improvement are considered limited. However, a willingness to understand true costs related to shrinkage and addressing these problems can lead to economic benefits.
Brouk (2010) determined that the cost of a corn-silage-based ration equaled $5.49 per head per day assuming zero shrinkage. Daily feed cost increased to $6.05/head when typical shrinkage values were applied to each feed ingredient in the diet. If shrinkage losses were reduced by 50% for each ingredient, daily feed costs were reduced to $5.75/head. The difference in daily feed cost of $0.30/head due to reduced shrinkage results in an annual savings of $100 per dairy cow.
Impact of Facilities on Shrinkage
Data in Table 1 show typical shrinkage values for different ingredients based on storage type. The storage options shown in Table 1 provide different levels of protection from weather. The minimum expected loss is 10% when ingredients are stored in uncovered open piles. Storage bins reduce storage losses to 2% to 5%. An 8% storage loss reduction of soybean meal reduces daily feed cost $0.095/head assuming a daily use of 6 pounds and $400/ton. Designing a feed center to minimize the impact of solar radiation, moisture, and wind may have economic returns due to reductions in shrinkage.
|
Ingredient |
Uncovered Open Piles |
Covered 3-Sided Bay |
Closed Bin |
|
Whole Cottonseed |
10 – 20% |
5 – 15% |
——- |
|
Dry Meal |
5 – 10% |
3 – 8% |
2 – 4% |
|
Soybean Hulls |
12 – 20% |
5 – 10% |
2 – 5% |
|
Dry Distillers |
15 – 22% |
7 – 10% |
3 – 5% |
|
Wet Distillers |
15 – 40% |
15 – 40% |
——- |
Normal shrinkage for commodity buildings (three-sided bay) is 8%. There are many places to reduce shrinkage when storing ingredients in commodity buildings. Common areas where shrinkage occurs include the following:
- Unloading on concrete slab – wind movement of ingredients, failure to move 100% of an ingredient into a bay
- Ration preparation – accuracy of measuring individual ingredients with a bucket loader is limited to about 1 to 2 cubic feet, resulting in over- or underfeeding individual ingredients
- Weather – building is often oriented based on prevailing wind, leaving feed exposed to blowing precipitation, resulting in spoilage due to rain or snow
- Number of bays – failure to empty bays completely often results in spoilage of ingredients along the back wall due to the inability to use them in a timely manner
- Management – more emphasis on time or getting cows fed versus accuracy of feed ration
- Feed center layout – efficiency in procurement of ingredients
Table 2 illustrates the impact of shrinkage on feed cost. Feed is purchased at a given cost per unit weight or volume. However, the actual feed cost may be significantly higher depending on shrinkage. For example, a dairy may pay $30 per ton of silage; however, if there are 20% losses, the actual cost per ton of silage used in the ration is $37.50. Reducing silage losses to 12% saves an estimated $3.43 per ton of silage fed.
Realistically, there will always be some shrinkage and loss. Each dairy must have a realistic target, and for most ingredients other than forages, 2% to 4% is a reasonable target. Fermented forages or grains will have some loss associated with the fermentation process. If this fermentation occurs at the dairy, the goal should be less than 10% for fermented forages and below 5% for fermented grains. Hurbaugh and Moeching (1984) and Hurbaugh et al. (1983) reported that on- and off-farm facilities handling whole corn had shrinkage of 1% or less.
Impact of Moisture on Shrinkage
Feed ingredients are often purchased on a wet basis but formulated into rations on a dry weight basis. The impact of moisture must be considered when evaluating shrinkage. Table 3 shows the impact on weight of a 1% change in moisture content for products at different initial moisture contents. An ingredient such as hay purchased and delivered at 15% initial moisture content which then dries while in storage to 14% has 1.16% less moisture. This impacts feed formulation unless moisture content is monitored to ensure that a ration contains appropriate ingredients on a dry weight basis. If moisture is not considered, then for every 1% reduction in moisture, there is a 1.16% to 2.78% increase in dry matter depending on the initial moisture content. Similarly, if moisture increases 1% due to rain or snow, there is 1.16% to 2.78% decrease in dry matter if the diet formulation is not adjusted.
Table 4 shows the increase in dry matter per ton of feed based on initial moisture content and moisture losses of 2%, 4%, and 8%.
| Purchased Feed Cost ($/ton) | Actual Feed Cost w/ 2% Shrinkage ($/ton) | Feed Cost Based on Percent Shrinkage | ||||
| 4% | 8% | 12% | 16% | 20% | ||
| 30 | $30.60 | $31.20 | $32.40 | $34.09 | $34.80 | $36.00 |
| 50 | $51.00 | $52.00 | $54.00 | $56.82 | $58.00 | $60.00 |
| 100 | $102.00 | $104.00 | $108.00 | $113.64 | $116.00 | $120.00 |
| 150 | $153.00 | $156.00 | $162.00 | $170.45 | $174.00 | $180.00 |
| 200 | $204.00 | $208.00 | $217.00 | $227.27 | $232.00 | $240.00 |
| 250 | $255.00 | $260.00 | $270.00 | $284.09 | $290.00 | $300.00 |
| 300 | $306.00 | $312.00 | $324.00 | $340.91 | $348.00 | $360.00 |
| 350 | $357.00 | $364.00 | $378.00 | $397.73 | $406.00 | $420.00 |
| 400 | $408.00 | $416.00 | $432.00 | $454.55 | $464.00 | $480.00 |
|
Initial moisture content (%) |
15% |
25% |
35% |
45% |
55% |
65% |
|
Weight change with 1% reduction in moisture content |
1.16% |
1.32% |
1.52% |
1.79% |
2.17% |
2.78% |
Another moisture concern is rain or snow entering open commodity storage sheds. Table 5 shows the amount of rain entering every linear foot of a commodity shed assuming 1 inch of moisture blows into a bay for different sidewall heights. For example, for a commodity shed with a 24-foot-high sidewall, 15 gallons of water per linear foot will enter a bay. If a curtain is dropped to reduce the opening to 8 feet (skid steer height), then 10 gallons of moisture are prevented from entering the bay, or a 67% reduction. A 50% reduction occurs if a curtain is dropped leaving a 12-foot (payloader height) opening. Lowering a curtain or flexible door at night or upon completion of feeding may prevent significant ingredient losses due to rainfall and subsequent spoilage. Frequency of rainfall events would determine curtain management and frequency of lowering. Curtains also minimize the impacts of wind and potential movement of ingredients between bays without solid dividers. Buildings storing commodities delivered in live bottom trailers may be able to reduce the sidewall height to a 14-foot opening using permanent materials.
|
Delivered Moisture Content (%) |
Moisture Loss in Storage (%) |
Delivered Dry Matter per Ton (lb) |
Impact of Moisture Lost |
|
|
Weight (lb) |
Percentage Increase in Dry Matter Concentration |
|||
|
15 |
2 |
1,700 |
1,740 |
2.4% |
|
4 |
1,780 |
4.7% |
||
|
6 |
1,820 |
7.1% |
||
|
25 |
2 |
1,500 |
1,540 |
2.7% |
|
4 |
1,580 |
5.3% |
||
|
6 |
1,620 |
8.0% |
||
|
35 |
2 |
1,300 |
1,340 |
3.1% |
|
4 |
1,380 |
6.2% |
||
|
6 |
1,420 |
9.2% |
||
|
45 |
2 |
1,100 |
1,140 |
3.6% |
|
4 |
1,180 |
7.3% |
||
|
6 |
1,220 |
10.9% |
||
|
55 |
2 |
900 |
940 |
4.4% |
|
4 |
980 |
8.9% |
||
|
6 |
1,020 |
13.3% |
||
|
65
|
2 |
700 |
740 |
5.7% |
|
4 |
780 |
11.4% |
||
|
6 |
820 |
17.1% |
||
Impact of Scales on Shrinkage
Table 6 shows the weighing accuracy of scales depending on the mixer capacity and scale accuracy. Producers adding small quantities of ingredients may reduce shrinkage by using a smaller stationary mixer with more accurate scales to preweigh these ingredients prior to moving ingredients into a larger mixer. Table 7 shows the typical ingredients in a corn-silage-based ration. Assuming a 10-ton mixer with 1% scale accuracy, the potential error ranges from 2% to 195% of the ingredient inclusion weights. For example, if 1,230 pounds of almond hulls are added to a 10-ton mix (Table 7), a 1% scale accuracy allows for measurement of this amount to the nearest 200 pounds, meaning that the potential exists for a ±16% weighing error of this ingredient. There is a familiar expression that someone “measures to the nearest 1/10 of an inch, marks with chalk, and cuts with an axe.” This occurs daily on most dairies as nutritionists formulate rations to the nearest pound, the weight readout may be to the nearest 10 pounds, and the fill mechanism into the mixer is a payloader that may have an accuracy of 50 to 100 pounds depending on the operator.
|
Height of open side (feet) |
Gallons moisture entering the commodity shed at full opening |
Impact of reducing opening to 8 feet |
Impact of reducing opening to 12 feet |
||
|
Reduction in gallons of moisture entering commodity bays |
Reduction as compared to fully open side wall |
Reduction in gallons of moisture entering commodity bays |
Reduction as compared to fully open side wall |
||
|
8 |
5.0 |
na |
na |
na |
na |
|
12 |
7.5 |
2.5 |
33% |
na |
na |
|
16 |
10.0 |
5.0 |
50% |
2.5 |
25% |
|
20 |
12.5 |
7.5 |
60% |
5.0 |
40% |
|
24 |
15.0 |
10.0 |
67% |
7.5 |
50% |
|
28 |
17.5 |
12.5 |
71% |
10.0 |
57% |
|
32 |
19.9 |
15.0 |
75% |
12.5 |
63% |
|
Mixer Capacity (tons) |
Scale Accuracy (%) |
|||
|
0.1 |
0.5 |
1 |
2 |
|
|
1 |
2 |
10 |
20 |
40 |
|
3 |
6 |
30 |
60 |
120 |
|
5 |
10 |
50 |
100 |
200 |
|
10 |
20 |
100 |
200 |
400 |
Accuracy is not related to the precision with which the scale may be read or set. The scale accuracy is determined by the mechanism (load cells) used to weigh the mixer box, not the digital display. A readout device on a mixer may read to the nearest 10 pounds, but even with a 1-ton mixer with 1% accurate scale, the actual accuracy is only guaranteed to the nearest 20 pounds.
There are two other basic types of scale errors (Ross, 2005). The first type of error (Type 1) is inconsistency of the scale. This type of error occurs when a scale reading is incorrect by a consistent percentage across the range of the scale. With this error, the digital display may read and print the correct weights for formulation but is off by a consistent percentage. Thus, the scale may add an extra 25% to the weight of each individual ingredient. When this error occurs, the ration is still formulated correctly, but each group of cows may be overfed by 25%. The weight of the proceeding ration may be adjusted down due to excessive weigh backs; however, the nutritionist never knows the exact quantity of feed being consumed by a pen of cows even if the percentage of individual ingredients may be at the right proportion. This can be problematic in part because expensive, low-inclusion ingredients (i.e., feed additives) may be formulated at higher concentrations in the diet in an attempt to achieve a desired intake on a per-cow per-day basis. The underestimation of feed intake therefore leads to excessive intake of these relatively expensive ingredients.
|
Feed Ingredient |
Daily Feed (lb/hd) |
Ingredient Weight per 10-Ton Batch (lb) |
Potential Weighing Error Assuming 1% Scale Accuracy |
|
Alfalfa Hay |
12 |
2,460 |
8.1% |
|
Corn Silage |
35 |
7,180 |
2.8% |
|
Flaked Corn |
14 |
2,870 |
7.0% |
|
Almond Hulls |
6 |
1,230 |
16.3% |
|
Canola Meal |
4.5 |
925 |
21.7% |
|
Dry Distillers Grains |
4 |
820 |
24.4% |
|
Whole Cotton Seed |
3 |
615 |
32.5% |
|
Rumen By-Pass Fat |
0.5 |
105 |
195.0% |
|
Minerals and Vitamins |
1.5 |
310 |
65.0% |
|
Liquid Whey |
15 |
3,080 |
6.5% |
|
Molasses |
2 |
410 |
48.8% |
The other error (Type 2) is consistent weight addition or subtraction. The scale adds a fixed amount of weight to every ingredient added to the ration. For example, 25 pounds is added to one ingredient formulated at a 500-pound inclusion rate, and 25 pounds is added to a second ingredient formulated at a 4,000-pound inclusion rate. In this case, the nutritionist may not realize the ingredients at smaller inclusion rates are being over- or underfed in the diet. This type of error may parallel health issues related to ingredients added at lower rates because the percentage of over- or underfeeding is much greater as compared to an ingredient such as corn silage.
Table 8 compares the impact of Type 1 and Type 2 scale errors. Type 1 shrinkage is uniform and independent of the ingredient inclusion rate. Type 2 shrinkage is inversely proportional to the ingredient inclusion rate; higher shrinkage occurs with lower inclusion rates.
Larger dairies may find it economically beneficial to install a stationary mixer where the operational conditions are more controllable and then use a feed delivery wagon to move feed to the bunks. The other advantage of a stationary mixer is automation and extra time available. Automation reduces the number of employees actually adding ingredients to the mixer. This increases the accuracy and reduces the variability due to human error in adding ingredients to the mixer.
Automatic control systems may be used to weigh individual ingredients while another batch is being delivered. Many ingredients may be stored in hopper bins reducing shrinkage. The authors are familiar with one stationary feed system where two augers, 12- and 6-inch augers, are installed in the boot of a bin to decrease the fill time. Both augers are started simultaneously; however, as the desired ingredient weight is reached, the 12-inch auger is turned off, allowing more accuracy as the 6-inch auger adds the final quantity of product. This system overcomes the typical concerns with slow fill times using hopper bins.
|
Feed Ingredient |
Daily Feed (lb/hd) |
Ingredient Weight per 10-Ton Batch (lb) |
Type 1 Error with 10% Extra |
Type 2 Error with 30 lb Extra |
||
|
Actual Weight (lb) |
% error |
Actual Weight (lb) |
% error |
|||
|
Alfalfa Hay |
12 |
2,460 |
2,710 |
10 |
2,490 |
1.2 |
|
Corn Silage |
35 |
7,180 |
7,900 |
10 |
7,210 |
0.4 |
|
Flaked Corn |
14 |
2,870 |
3,160 |
10 |
2,900 |
1.0 |
|
Almond Hulls |
6 |
1,230 |
1,355 |
10 |
1,260 |
2.4 |
|
Canola Meal |
4.5 |
925 |
1,015 |
10 |
955 |
3.2 |
|
Dry Distillers Grains |
4 |
820 |
900 |
10 |
850 |
3.7 |
|
Whole Cottonseed |
3 |
615 |
675 |
10 |
645 |
4.9 |
|
Rumen By-Pass Fat |
0.5 |
105 |
115 |
10 |
135 |
28.6 |
|
Minerals and Vitamins |
1.5 |
310 |
340 |
10 |
340 |
9.7 |
|
Liquid Whey |
15 |
3,080 |
3,385 |
10 |
3,110 |
1.0 |
|
Molasses |
2 |
410 |
450 |
10 |
440 |
7.3 |
|
TOTAL |
|
20,000 |
22,000 |
10 |
20,330 |
1.7 |
Wind and Shrinkage
Windbreaks (Figure 1) can be used to reduce shrinkage around three-sided commodity buildings. A windbreak protects an area 10 times the height of the windbreak. If the windbreak is 10 feet high, then the protected area is 100 feet. The snow dump area is four times the windbreak height. The distance between the feed center and the windbreak should be at least four times the height of the wind to prevent snow from piling in the feed center or covering traffic roads. Normally, it is recommended that windbreaks have 20% openings; however, around feed centers, this is not as critical. A permanent windbreak is recommended because shrinkage losses due to wind occur year round. Some opt to store hay or bedding around the perimeter of the feed center or pens. This option limits wind protection to only those periods when the hay or bedding is being stored.
Dairies located in areas with colder climates or excessive rainfall may benefit from placing the entire feed center under a roof to eliminate moisture and wind problems. Silage is delivered from the silage storage area daily and placed in a bay inside the building. Several bays are also available for ground hay. Hay storage remains in separate buildings until ground or immediately prior to usage. Working with the ingredient suppliers and trucking firms is critical prior to construction because adequate room must be available inside the building to maneuver semi-trucks. More space is required if trucks are required to back into bays prior to unloading versus unloading on a slab (with the ingredients pushed into a bay).

Figure 1. Illustration of impact of windbreak on protecting a feed center.
Low-density feed ingredients should be delivered in self-unloading trucks (walking floors) when ingredients are stored in open-front commodity buildings. Many dairies have reported significant shrinkage when low-density products are unloaded on an apron prior to transferring into a bay on windy days. If ingredients are unloaded on an apron, the shrinkage is minimized by immediately moving the materials into a bay.
Wind speeds of 6 mph may cause soil movement in highly erodible fields. Sand with a dry weight density 4 to 10 times that of most feed ingredients begins movement at 12 mph. Reducing wind speeds around the feed center is critical to minimize shrinkage as well as preventing deposits of soil from adjacent areas into the commodity bays. Assuming feed ingredients begin moving at wind speeds of 5 mph, Table 8 shows the impact of wind speed on potential losses assuming feed particles begin blowing away if stored in an open pile. The impact factor in Table 9 illustrates that the potential increase in feed losses due to wind are 8 times greater at 10 mph than at 5 mph. As wind speed increases, there is an exponential increase in potential losses due to the cubic relationship between wind speed and particle movement.
Table 9. Potential impact of wind speed on feed losses based on the assumption that there are no feed particle losses at wind speeds of 5 mph or less.
|
Wind Speed (mph) |
Potential increases in relative feed losses assuming no ingredient losses at wind speeds of 5 mph or less |
|
5 |
No losses |
|
10 |
8 |
|
15 |
27 |
|
20 |
64 |
|
25 |
125 |
Windbreaks also help minimize soil and foreign matter from accumulating in the feed center area. Feed centers surrounded by large crop acreages often serve as a windbreak, causing materials to settle out in commodity bays during wind storms. This foreign matter is included as part of individual ingredient weights, resulting in feed formulation errors. Average annual soil losses due to wind were reported at 2.5 tons per acre of land (Lyles, 1975). Wind erosion is higher from fields with less surface residue such as corn silage fields. An exterior windbreak causes this material to settle prior to entering the feed center area.
Designing Feed Centers to Minimize Shrinkage
Figure 2 provides an illustration of a windbreak around a feed center. The windbreak should be located at least four times the height of the windbreak away from the feed center. This space will serve as a snow dump area. If snow is not an issue, the windbreak may be located closer to the feed center. “L”-shaped commodity sheds provide protection from the wind from multiple directions. Feed center protection is increased if the building is oriented such that the prevailing wind is perpendicular to the intersection of the two building sides (corner of the “L”) than along one side. A single row of commodity bays may be modified along one side to include a second building to provide additional wind protection. Many dairies also need a place to store additional commodities, ground hay, or daily silage needs prior to feeding.
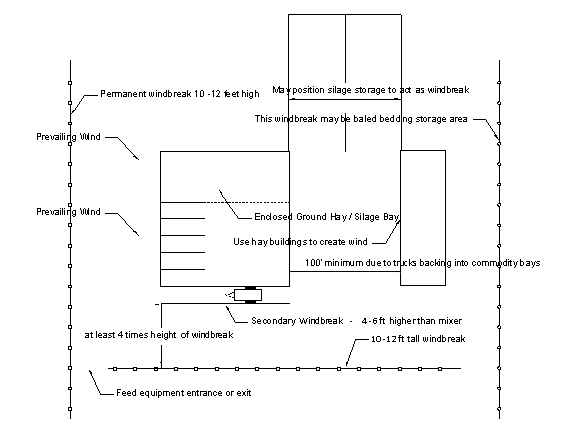
Figure 2. Utilization of buildings and windbreaks to minimize shrinkage due to wind.
Figure 3 provides an illustration of a totally enclosed commodity building. The advantage to this building is that weather-related shrinkage losses are minimized. The overall building width is typically 60 to 80 feet wider than a three-sided commodity building. This is necessary to provide room inside the building to maneuver semi-trucks delivering ingredients. The authors recommend consulting with trucking firms to make sure there is adequate room. Significant reductions in open space may increase feed loading time because feed loading equipment may not have free space to maneuver rapidly.

Figure 3. Illustration of totally enclosed commodity building using a portable mixer.
Figure 4 illustrates a feed center with a stationary mixer. There is room around the mixer to use micro ingredient tanks as well as liquid tanks. Stationary mixers enable more hopper bottom tanks with automated handling equipment to be utilized for low inclusion rate ingredients and liquids. Commodity bays are in close proximity to the stationary mixer, allowing adequate time to secure individual ingredients. Another advantage is minimum losses due to weather shrinkage.

Figure 4. Illustration of a feed center with a stationary mixer.
Summary
Minimizing feed shrinkage can improve the bottom line of a dairy. Weather-related shrinkage due to wind and moisture may be minimized with proper feed center design. Utilizing existing records can provide an opportunity to explore actual shrinkage on a dairy and the potential economic return to minimizing such losses. There are management opportunities to reduce shrinkage due to weather and spoilage in existing facilities, even without automation.
Author Information
J. P. Harner, Kansas State University, Dept. of Biological & Agricultural Engineering, 129 Seaton Hall, Manhattan, KS 66506. Phone: 785-532-5580, email: jharner@ksu.edu
J. F. Smith, Kansas State University, Dept. of Animal Sciences & Industry, 136 Call Hall, Manhattan, KS 66506. Phone: 785-532-1203, fax: 785-532-5681, email: jfsmith@ksu.edu
M.J. Brouk, Kansas State University, Dept. of Animal Sciences & Industry, 136 Call Hall, Manhattan, KS 66506. Phone: 785-532-1203, fax: 785-532-5681, email: mbrouk@ksu.edu
B. J. Bradford, Kansas State University, Dept. of Animal Sciences & Industry, 135 Call Hall, Manhattan, KS 66506. Phone: 785-532-7974, email: bbradfor@ksu.edu
References
Brouk, M.J. 2010. Issues in feed cost. PowerPoint presentation handout.
Brouk, M.J. 2009. Don’t let shrink kill you with high feed prices. 2009 Western Dairy Management Conference, Reno, NV. March 11-13, 2009. Pp 227-231.
Dutton, C. 1998. Feed shrink at Chaput Family Farms. Proceedings from Dairy Feeding Systems, Management, Components and Nutrients Conference. NRAES-116. NRAES Cooperative Extension Service, Ithaca, NY. Pp 230-38.
Harburgh, C.R. and B.W. Moechnig. 1984. Shrinkage and other corn-quality changes from drying at commercial elevators. Transactions of ASAE. Pp 1176-80.
Hurburgh, C.R., C.J. Bern, W.F. Wilcke, and M.E. Anderson. 1983. Shrinkage and corn quality changes in on-farm handling operations. Transactions of ASAE. Pp 1854-57.
Kertz, A.F. 1998. Variability in delivery of nutrients to lactating dairy cows. J. Dairy Sci. 81:3075.
Lyles, L. 1975. Possible effects of wind erosion on soil productivity. Journ. Soil and Water Cons. 30:279-283.
Ross, D. 2005. Watch Mixer Scale Accuracy. Dairy Correspondence. Michigan State University Cooperative Extension Service, Livingston County, MI. http://www.co.livingston.mi.us/msuextension/dairyNews/Mixer%20Scale%20Ma….