Introduction
The term “quality of the pregnancy” refers to the value of the calf that is going to be born. The genetic merit of the calf affects the phenotypic performance later in life and thus the calf’s value. With the advent of sexed and gender-biased semen, producers can increase the probability that a female calf will be born and thereby the expected value of the calf as well. This paper considers three aspects of the genetic merit of calves.
The first part of this paper looks at the investment value of inseminating females with semen from service sires with different genetic merits, sire conception rates (SCR), and prices. These aspects were chosen because prices are an upfront investment cost, SCR affects the ability to get the female pregnant from the semen, and the genetic merit is expected to be expressed in the calf that will be born if the insemination is successful.
The second part is an illustration of the value of genomic testing of heifer calves in combination with the use of sexed semen to generate extra heifer calves. The availability of good reproductive programs and sexed semen allows for generation of more heifer calves than are needed to replace culled cows. Genomic testing of heifer calves, such as with the 3K SNP test, improves the accuracy of the selection of those heifer calves with the highest genetic merit at the cost of testing. Surplus calves could be sold. The profitability of this system depends both on the ability of the program to generate more heifer calves and the net benefit of genomic testing.
The third part is a brief comparison of the value of genomic testing of heifer calves with the value of purchasing semen from sires with greater genetic merit and SCR. Our analyses are aimed at dairy producers who sell cull animals for beef but not breeding stock. We will also limit the discussion to heifer calves and assume that the value of a bull calf is not affected by his sire.
Please check this link first if you are interested in organic or specialty dairy production.
Investment Analysis of Sire Genetic Merit, Sire Conception Rate, and Price
Animals have genetic merits for different traits of economic importance such as milk production, daughter pregnancy rate, productive life, somatic cell score, and udder composite. The genetic merits of multiple traits can be combined in a selection index, such as lifetime net merit (NM$) calculated by USDA-AIPL (Cole et al., 2010). It combines production, fertility, health, and type traits in an optimal way. The NM$ is an estimate of the expected lifetime profit of a female compared to the breed base. The breed base animal, an average cow born in 2005, has a NM$ of $0. Lifetime is about three years after first calving. A sire with a predicted transmitting ability (PTA) for NM$ of $400 is expected to have daughters that are on average $300 more profitable than a sire with a PTA NM$ of $100.
The economic weights of the traits are the marginal effects of a change of one unit of each trait on profitability (Table 1). The alternative selection indices Cheese Merit (CM$) and Fluid Merit (FM$) have different weight for the traits protein, fat, milk, and somatic cell score and can be more appropriate in markets where milk is sold primarily for cheese production or fluid consumption. We focused on NM$. The August 2011 genetic evaluation of 605 active Holstein or Red and White sires run by USDA-AIPL showed that the median sire had a NM$ of $273. The top 5% of sires had NM$ greater than $543, and the bottom 5% had a NM$ less than -$68. Thus, there is quite a bit of variation in the expected lifetime profitability of daughters of active AI sires.
|
Trait1 |
Units |
Standard |
Value ($/PTA unit) |
Relative value (%) |
||||
|
NM$ |
CM$ |
FM$ |
NM$ |
CM$ |
FM$ |
|||
|
Protein |
Pounds |
19 |
3.41 |
7.52 |
0 |
16 |
25 |
0 |
|
Fat |
Pounds |
27 |
2.89 |
2.89 |
2.89 |
19 |
13 |
20 |
|
Milk |
Pounds |
723 |
0.001 |
−0.119 |
0.107 |
0 |
−15 |
19 |
|
PL |
Months |
2.5 |
35 |
35 |
35 |
22 |
15 |
22 |
|
SCS |
Log |
0.23 |
−182 |
−235 |
−91 |
−10 |
−9 |
−5 |
|
Udder |
Composite |
0.90 |
32 |
32 |
32 |
7 |
5 |
7 |
|
Feet/legs |
Composite |
1.03 |
15 |
15 |
15 |
4 |
3 |
4 |
|
Body size |
Composite |
1.03 |
−23 |
−23 |
−23 |
−6 |
−4 |
−6 |
|
DPR |
Percent |
1.70 |
27 |
27 |
27 |
11 |
8 |
12 |
|
CA$ |
Dollars |
20 |
1 |
1 |
1 |
5 |
3 |
5 |
|
1 PL = productive life, SCS = somatic cell score, DPR = daughter pregnancy rate, CA$ = calving ability. |
||||||||
One aspect of an investment decision in semen is the expected lifetime profitability of a daughter, but other factors must be considered as well. In the 1970s and 1980s, many studies were published that evaluated net returns from semen purchases of genetically superior sires (e.g., Everett, 1975; McGilliard, 1978; Rogers, 1990). Many different formulas exist, but they essentially consider:
- the expected relative profitability of a daughter, such as measured by NM$,
- gene flow and discounting, and
- probability of conception.
Gene flow is the concept that the genetic merit of the calf is actually going to be expressed in herself and her offspring. This depends on the probability of survival as a heifer and the number of female offspring she is expected to produce. Only half of the genetic merit of an animal is passed on to the next generation. Females can have several female calves, depending on whether sexed semen is used, cull rates, etc. Discounting of cash flows must be applied because revenues and costs occur in the future. We assumed a 5% annual interest rate. We then calculated the combined gene flow and discounting to be 1.36.
Sires vary by their probability of conception, expressed as sire conception rate (SCR; Norman et al., 2008). Sires with lower SCR are expected to get females pregnant later in lactation, which increases the days open (DO) of the female. Assuming a 50% 21-day service rate, four extra DO per 1% greater pregnancy rate (VanRaden et al., 2004), and $2 cost per extra DO, then an SCR of 2% decreases DO cost by 2% * 100 * 50% * 4 * $2 = $8.
|
Sire |
Probability of conception |
Probability of heifer calf |
NM$ |
Gene flow and discounting factor |
Cost of days open adjustment |
Present value |
|
Sire A |
42% |
50% |
$300 |
1.36 |
$8 |
$94 |
|
Sire B |
37% |
50% |
$450 |
1.36 |
-$12 |
$101 |

Figure 1. Lifetime net merit (NM$) and present value (PV) for 166 sires with service sire conception rate and price information. Data from the August 2011 sire evaluation run.
The present value (PV) of an insemination by any sire can be approximated as follows: PV = probability of conception * (probability of heifer calf * NM$ * gene flow and discounting factor) + cost of DO adjustment. An average sire with NM$ = 0 and SCR = 0% has PV = 0$. Table 2 gives two examples. The average probability of conception is 40%, and the probability of a heifer calf is 50%. Sire A has a PTA NM$ of $300, SCR is +2%, and his PV is +$94. Sire B has a PTA NM$ of $450, SCR is -3%, and his PV is $101. That means that if semen from sire A costs $20, a producer could afford to pay up to $28 for semen from sire B.
We obtained NM$ and SCR data from all active AI sires in the August 2011 evaluation from USDA-AIPL (Format 38 file at http://aipl.arsusda.gov/eval.htm#file) and combined that with published retail prices from two AI companies. The data were limited to those 166 sires that had both SCR and price information in September 2011. Maximum, average, and minimum values were NM$ ($852, $484, -$157), SCR (+5.3%, 1.4%, -3.6%), price ($100, $29, $10), and PV ($243, $142, -$41). Figure 1 shows how NM$ and PV are associated for these 166 sires. The correlation between NM$ and PV was very high (r = 0.95). This means that SCR had little effect on the PV.
Figure 2 is a plot of the published semen retail prices and the NPV of the semen for the two AI companies. The net present value (NPV) is the PV minus the semen cost. Figure 3 is the same plot with semen prices set to one-third of the retail price because most dairy producers pay less than the full retail price. There is a clear difference between companies concerning the relationship between their published retail price and the NPV of the semen they sell. The overall correlation between NPV and semen price is only 0.16, where it is 0.57 for one company and 0.34 for the other company.
When the retail semen price is assumed, the NPV for the 166 sires ranged from $198 to -$79, a difference of $276. The return on investment varied between $10.35 and -$2.08 per dollar spent on semen (Figure 4). When only one-third of the retail semen price is assumed, the NPV varied between $228 and -$54. Return on investment varied between $33.06 and -$4.23 per dollar. The correlation between NM$ and return on investment was 0.44. Lower-priced semen resulted in a greater return per dollar invested, but within each price class, there was a large variation in return on semen investment. It seems important that dairy producers are aware of the very different NPV of semen that is similarly priced. Normally, the highest NPV sires should be chosen unless the economic weights of the traits are valued quite differently on the dairy farm.

Figure 2. Retail semen price and net present value (NPV) for 166 sires with sire conception rate and price information. Data from the August 2011 sire evaluation run and published retail prices of September 2011 from two AI companies. NPV above $0 implies that it is profitable for a dairy producer to purchase semen from that sire.
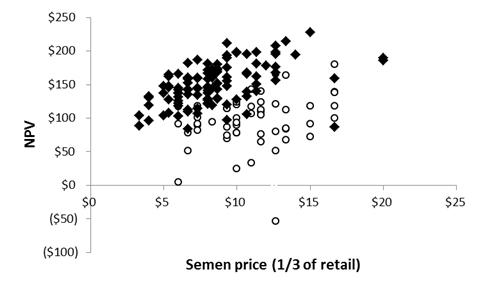
Figure 3. Semen price and net present value (NPV) for 166 sires with sire conception rate and price information. Data from the August 2011 sire evaluation run and published retail prices of September 2011 from two AI companies. Most dairy producers pay less than the full retail price. Therefore, the semen price was set to one-third of the retail price. NPV above $0 implies that it is profitable for a dairy producer to purchase semen from that sire.

Figure 4. Return per dollar retail semen cost for 166 sires with sire conception rate and price information. Data from the August 2011 sire evaluation run and published retail prices of September 2011 from two AI companies.
Combining the Use of Sexed Semen and Genomic Testing of Dairy Calves
Dairy producers have had the opportunity to test their female animals with the low density 3K SNP genomic test since September 2010. The 3K genomic test provides an estimate of an animal’s genetic merit for many traits, including NM$. A genomic test can provide a fairly accurate estimate of an animal’s genetic merit early in her life with or without any other data, such as her phenotypic records or information from parents or siblings. As of August 2011, approximately 45,000 animals have been tested with the 3K genomic test, most of them females. Still, many dairy producers wonder if the 3K genomic test might have value for their operation.
Genomic testing is useful, among other things, for better ranking calves based on their genetic merit in order to select which calves to raise as replacements. Non-selected surplus calves can then be sold at an early age, avoiding investment in rearing costs that are difficult to recover. Because the increase in reproductive efficiency and the use of sexed semen is producing many heifer calves on many dairy farms, choosing which calves to raise based on their genetic merit, among other factors such as early life health events, has become a real option that now needs to be evaluated.
Genetic progress is made by selecting superior animals as the parents of future generations. If all heifer calves are raised, virtually no genetic progress is made on the female side. In other words, all genetic progress in the herd then comes only from using genetically superior AI (artificial insemination) sires. But if there is a way to select the genetically better heifer calves to be raised as replacements, the dairy producer can make genetic progress on the female side as well, which in turn causes total genetic progress to increase faster. One scenario is then as follows:
- Produce more heifer calves than are needed to supply the farm with replacement heifers.
- Rank heifer calves based on pedigree information, if available.
- Selectively test some heifer calves with a genomic test to improve accuracy of ranking.
- Select heifer calves needed to be raised. Non-selected heifer calves are sold.
Heifer Calf Selection and Genomic Testing
A complete economic evaluation of this scenario has many aspects. This includes all herd revenues and costs as a result of a reproductive program that produces more heifer calves (if any) than are needed to enter the herd as calving heifers. In addition, it includes the value of the increased genetic progress due to the ability to select among the available heifer calves, possibly enhanced by genomic testing.
The genetic progress from selection among heifer calves is dependent on three factors. First, genetic variation for a trait, measured by the standard deviation, must exist in the population from which the calves are selected. The standard deviation of the true breeding values for NM$ is approximately $350. Second, genetic progress depends on how accurately we can estimate the true breeding value of each calf. Accuracy may be defined as the square root of reliability. When full pedigree information about heifer calves is available, the reliability of the estimated breeding values is approximately 35%. A genomic test, such as the 3K test, can increase this reliability to approximately 65%. Greater reliability means a better ranking of the calves; therefore, we can better select the truly genetically best animals. This means greater genetic progress among the selected animals (and lower genetic values of the non-selected animals).
It may not be cost effective to test all heifer calves with a genomic test. Which animals should be tested depends on the reliability of the pre-ranking based on pedigree information, the reliability of the genomic test, the cost of the genomic test, and the fraction of available heifer calves that needs to be selected (De Vries et al., 2011). For example, when most of the heifer calves need to be selected and kept, there is no value in testing the heifer calves with the highest rank based on pedigree information alone because it is very unlikely the genomic test will move them to the bottom 10%. Weigel (2011) showed how testing the top 50% of pre-ranked animals would be enough when a small fraction of animals needed to be selected. Testing the bottom 50% would be enough when a large fraction of animals needs to be selected. The best decision might be to test a number of animals that are pre-ranked neither top nor bottom.
Table 3 shows this principle. For example, when 80% of heifer calves need to be selected, pre-ranking based on their Parent Averages with a reliability of 35% would give this group of heifer calves an estimated breeding value (EBV) of $72 (the average of all animals is $0). The 60th through the 90th percentile (30%) of the pre-ranked calves should be tested with a genomic test with reliability of 65% and cost of $45 per test. This increased the EBV of the newly selected calves to $93. The cost of testing per selected calf was $45 * 30% / 80% = $17. The NPV of the selected calves was $112. An average selected calf – and her future offspring – is expected to be $112 more profitable than an average calf before selection. The value of the 20% non-selected calves is not yet included.
Analysis of Value of Herd Reproductive Program Including Heifer Selection
Table 3 shows that the value of the selected calves increases when the selection intensity is greater. But to generate a surplus of calves, the dairy farm may need to use more sexed semen and/or improve its reproductive efficiency. Both may come at additional costs. We used a comprehensive dairy herd simulation model (v.dairyplan; De Vries, 2011) to illustrate how a dairy herd reproductive program could be combined with heifer calf selection to find the most profitable scenario. This model includes both young stock and adult cows. Numerous inputs such as mortality and involuntary culling risks, lactation curves, probabilities of conceptions, feed intakes, breeding values, and prices were combined to generate outputs such as revenues and costs per cow per year and number of heifer calves born.
|
Calves selected |
EBV of selected calves based on Parent Average only |
Optimal fraction of all calves tested with genomic test2 |
EBV of selected calves based on genomic testing |
Cost of genomic testing per selected calf |
PV of selected calves3 |
NPV = PV of selected calves minus cost of genomic testing |
|
100% |
$0 |
– |
– |
$0 |
$0 |
$0 |
|
90% |
$40 |
70-100 |
$55 |
$15 |
$77 |
$62 |
|
80% |
$72 |
60-90 |
$93 |
$17 |
$129 |
$112 |
|
70% |
$103 |
50-90 |
$135 |
$26 |
$188 |
$162 |
|
60% |
$133 |
40-80 |
$172 |
$30 |
$239 |
$209 |
|
50% |
$165 |
30-70 |
$213 |
$36 |
$295 |
$259 |
|
1Assumptions: Reliability of Parent Average is 35%, reliability of genomic test is 65%, cost genomic test is $45 per tested animal, standard deviation of true breeding value for net merit is $350. |
||||||
|
Statistic |
Scenario |
|
|
No sexed semen |
2x sexed semen in heifers |
|
|
Calves needed (#/cow/yr) |
0.448 |
0.448 |
|
Calves available (#/cow/yr) |
0.537 |
0.640 |
|
Heifer calves selected (%) |
83% |
70% |
|
Average EBV dams in herd ($) |
110 |
112 |
|
Average EBV calves born in herd ($) |
452 |
456 |
|
Young stock pregnancy rate (%) |
30 |
25 |
|
Adult cows pregnancy rate (%) |
18 |
18 |
|
Milk yield (kg/cow/year) |
11,896 |
11,897 |
|
Inseminations (#/cow/year) |
3.06 |
3.20 |
|
Revenue ($/cow/year) |
4,949 |
4,910 |
|
Costs ($/cow/year) |
4,478 |
4,444 |
|
Profit ($/milking cow/year)1 |
471 |
466 |
|
1 Excludes value of heifer calves. |
||
Key results of two scenarios before the value of heifer selection are shown in Table 4. In the first scenario, no sexed semen was used. In the second scenario, sexed semen was used in all first and second inseminations of heifers but not in cows. Genetic testing of calves occurred at 4 months of age. The scenario with sexed semen generated 0.640 heifer calves per cow where only 0.448 heifer calves per cow are needed to replace culled cows. Thus, 70% of heifer calves were selected, whereas 83% of heifer calves were selected in the scenario without sexed semen. The average EBV of the born calves in the sexed semen scenario was $456, whereas it was $452 in the other scenario. This occurs because younger dams are on average genetically superior to older dams. Excluding the value of heifer calves, profit per cow per year in the sexed semen scenario was $466 versus $471 in the scenario without sexed semen.
Table 5 shows the value of selection among the heifer calves. Heifer calves can be pre-ranked, for example based on Parent Average, with a reliability of 35%. After the pre-ranking, an optimal genomic testing plan is applied with 65% reliability and at a cost of $45 per tested calf. The sexed semen scenario
|
Pre-ranking calf reliability |
No sexed semen |
2x sexed semen |
||
|
0% |
35% |
0% |
35% |
|
|
Genomic testing policy1 |
20-100 |
70-90 |
0-100 |
50-90 |
|
Statistics ($/cow/year): |
||||
|
Profit without heifer calf value |
471 |
471 |
466 |
466 |
|
Heifer calves sold |
18 |
18 |
39 |
39 |
|
NPV calves before pre-ranking |
123 |
123 |
125 |
125 |
|
NPV calves due to pre-ranking |
0 |
38 |
0 |
64 |
|
Added NPV due to genomic testing |
48 |
9 |
88 |
20 |
|
Cost of genomic testing |
9 |
5 |
29 |
12 |
|
Profit including heifer calf value |
651 |
654 |
688 |
702 |
|
1 20-100 means that the calves pre-ranked in the 20 to 100 percentiles are tested. 100% percentile is the lowest-ranking calf, 0% is the highest-ranked calf based on Parent Average. |
||||
has created more heifer calves and therefore has more surplus heifer calves to sell at $200 per calf (worth $39 per cow versus $18 per cow per year). The NPV of the calves includes their EBV minus the $200 market value. Pre-ranking with 0% reliability has no effect on genetic progress in the selected calves because ranking is random. But pre-ranking with reliability of 35% added $64 versus $38 per cow for the sexed semen and no sexed semen scenarios, respectively. Genomic testing was less valuable when pre-ranking was based on a greater reliability. In addition, fewer calves needed to be tested. Finally, the profit per cow including the value of the heifer calves was greater in the sexed semen scenario than the scenario where sexed semen was not used. Pre-ranking of the heifer calves with 35% reliability was more valuable when selection intensity was greater.
The described scenarios are only illustrations. More issues need to be addressed. For example, maybe more cows should be culled when a large number of heifers are available. Further, if heifer calves are tested with a genomic test, then over time more and more cows will have EBV with a high reliability. This should have consequences for the insemination policy to generate heifer calves. For example, sexed semen could be used on the genetically superior females while simultaneously weighing the risk of getting the genetically superior females pregnant in time. How many surplus heifer calves should be created may depend on which females are chosen to be dams of the next generation. This decision problem may also have consequences for the choice of sires.
Genomic Testing vs. Semen Purchases
Genomic testing in the scenario without sexed semen created a return over investment of $48 / $9 = $5.37 (0% reliability of pre-ranking) or $9 / $4 = $1.82 (35% reliability of pre-ranking) to the profit per cow per year. In the sexed semen scenario, these returns on investment were $88 / $29 = $3.06 and $20 / $12 = $1.73, respectively. These returns need to be compared to the returns on investment of purchasing semen from more superior sires, as is shown in Figure 4. Sometimes it is more valuable to purchase semen from sires with greater genetic merit than it is to genomically test heifer calves. On the other hand, other benefits of genomic testing such as avoiding inbreeding have additional value.
Conclusions
Low-cost semen is attractive to producers, but the most profitable mate may not be the bull with the highest PTA for NM$. The semen with the highest NPV should be selected, unless economic weights of traits are valued quite differently. Genomic testing of the lowest-ranked calves based on their Parent Averages should be used to identify the poorest replacements in the herd, which should be sold, particularly when the rankings are based on genetic values with low reliabilities. Profit per cow is probably maximized when genomic testing is used in conjunction with sexed semen. It may be more valuable to purchase semen from sires with greater genetic merit than to genomically test heifer calves in some scenarios. It is not simple to find optimal insemination and selection policies. Improved on-farm tools are needed in order for dairy producers to take fullest economic advantage of these options.
Literature Cited
Cole, J.B., P.M. VanRaden, and Multi-State Project S-104. 2009. Net merit as a measure of lifetime profit: 2010 revision. USDA-AIPL research report NM$4 (12-09). Available at http://aipl.arsusda.gov/reference/nmcalc-2010.htm.
De Vries, A. 2011. Linear programming to evaluate the economics of reproductive efficiency and sexed semen considering herd constraints. Midwest ADSA/ASAS meetings (Abstr.) 27.
De Vries, A., D.T. Galligan, and J.B. Cole. 2011. The use and economic value of the 3K SNP genomic test for calves on dairy farms. Florida Extension Publication AN270. Available at http://edis.ifas.ufl.edu/an270.
Everett, R.W. 1975. Income over investment in semen. J. Dairy Sci. 58:1717-1722.
McGilliard, M.L. 1978. Net returns using genetically superior sires. J. Dairy Sci. 61:250-254.
Norman, H.D., J.L. Hutchison, and J.R. Wright. 2008. Sire conception rate: A new national AI bull fertility evaluation. USDA-AIPL Research Report SCR1 (7-08). Available at http://aipl.arsusda.gov/reference/arr-scr1.htm.
Rogers, G.W. 1990. A utility function for ranking sires that considers production, linear type traits, semen cost, and risk. J. Dairy Sci. 73:532-538.
VanRaden, P.M., A.H. Sanders, M.E. Tooker, R.H. Miller, H.D. Norman, M.T. Kuhn, and G.R. Wiggans. 2004. Development of a national genetic evaluation for cow fertility. J. Dairy Sci. 87:2285-2292.
Weigel, K.A. 2011. Using genomics on the farm. Proc. Western Dairy Mgmt. Conf., Reno, NV, pp 127-139.